Three ways we measure a local business’s map share
How we turn Google Maps rankings into numbers we can track, from one keyword at one location to many keywords across a whole group.
Three ways we measure a local business’s map share:
- Single location, single keyword
- Single location, multiple keywords
- Multiple locations, multiple keywords (chains, franchises, private equity)
Map share is the share of search points across the scanned area where a business appears in Google’s top three map results. We check each search from 169 points, because results depend on where the searcher is.
We work across many sectors. For this example we picked two: a dental group (multi-site healthcare), whose patients come to its offices, and an HVAC company (home services), which goes to its customers. Neither is a client, but the scans are real, run in Phoenix on October 5, 2026. Names left out.
Why the top three
Businesses that appear among the map’s top three got 126% more search traffic and 93% more calls, website clicks and direction requests than the ones just below (SOCi, 300,000 Google listings). And in a BrightLocal survey of 1,227 US consumers, 52% started their last local search on Google Search and 9% on Google Maps.
One caveat: the SOCi study measured Google’s map results in 2022. As more people ask AI assistants for recommendations, how leads split between maps, search and AI is still settling. In a future piece I’ll discuss how we approach AI visibility for local businesses.
How to read the tables
- Map share: The share of search points across the scanned area where a business appears in Google’s top three map results. We search from 169 points across the area. Ads are not counted. Change the area and the number will most likely change too, so we compare scans of the same area.
- This business: The dental office or HVAC location shown in that example.
- Main competitor: The rival with the highest map share overall, averaged across the keywords in that example. Picked separately at each location. The same brand’s other locations are excluded.
- Highest map share (anyone): On one keyword’s map, the best share anyone holds: this business, the main competitor or another rival. Other rivals are lettered A, B, C, so the same letter means the same business.
- Highest map share (mixed): For one location, the best share on each keyword’s map, averaged. A different business can lead each keyword, so it is a benchmark for that map, not one business.
1. Single location, single keyword
A dental office: #1 at its own door. Map share: 7%.
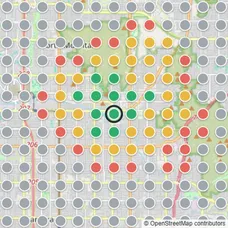
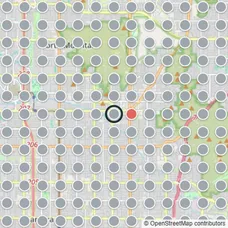
A dental office in Phoenix and one keyword, “dentist”, searched from 169 points half a mile apart. It is #1 at its own address, but its map share is 7%, and it is outside the top 20 on 63% of the map. On this map, 36 different dental offices are #1 somewhere.
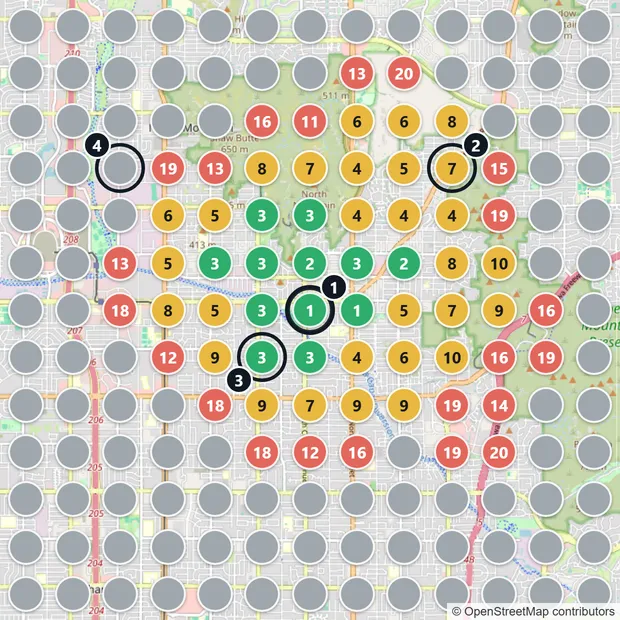
(1) The office, searched from its own door: #1. (2) Each dot is one Google search for “dentist” from that spot; the number is the office’s rank there, here #7. (3) Green: the top three, the only dots that count toward map share. (4) Gray: not in the top 20. Map share = green dots ÷ all dots: 12 ÷ 169 = 7%.
An HVAC location: over 13,000 reviews, and #1 nowhere on its own map.
An HVAC company’s most-reviewed location and one keyword, “ac repair”. It appears in the top 20 on 99% of the map, and its map share is 44%, yet it is #1 at none of the 169 points. A competitor with 739 reviews is #1 on most of it. Review count alone doesn’t buy the top spot.
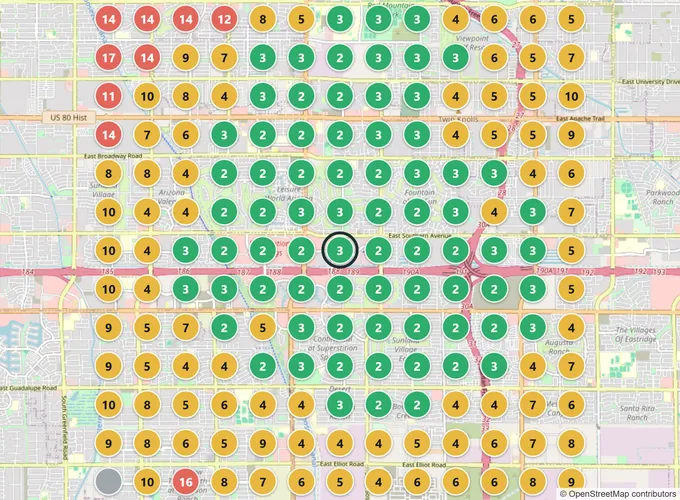
“ac repair” from 169 points around the HVAC location. Green: top 3. Yellow: 4 to 10. Red: 11 to 20. Gray: not in the top 20.
2. Single location, multiple keywords
A dental office: eight keywords, eight different maps.
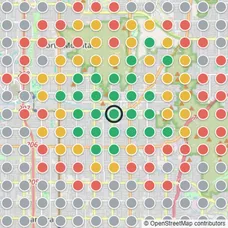
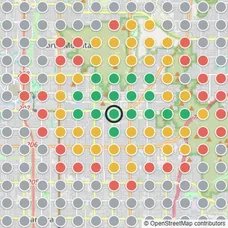
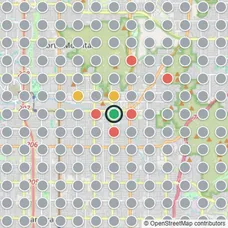
The same dental office, one map per keyword. Each map shows where it ranks, but with eight of them, tracking change and monitoring performance from one scan to the next gets hard.
 root canal
 dental clinic
 dentist
 teeth cleaning
 cosmetic dentist
- teeth whitening
 dental implants
- family dentist
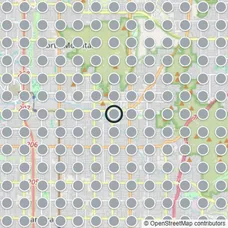
The same office’s eight keyword maps, in the order of the table below. Green: top 3. Yellow: 4 to 10. Red: 11 to 20. Gray: not in the top 20.
The same eight maps, as one table.
The same dental office across eight keywords. Its best is “root canal”, at a 15% map share. For “cosmetic dentist”, “family dentist” and “teeth whitening” it is not in the top 20 anywhere. Its main competitor, the strongest across all eight keywords, averages 13% to the office’s 4%.
How we track it: one map share per keyword, as in the table. We can always go back to any keyword’s full map from that scan.
| Keyword | This business | Main competitor | Highest map share (anyone) |
|---|---|---|---|
| root canal | 15% | 0% | 50% (Competitor A) |
| dental clinic | 10% | 13% | 27% (Competitor B) |
| dentist | 7% | 22% | 22% (main competitor) |
| teeth cleaning | 1% | 16% | 33% (Competitor C) |
| cosmetic dentist | 0% | 6% | 95% (Competitor D) |
| teeth whitening | 0% | 1% | 91% (Competitor E) |
| dental implants | 0% | 0% | 81% (Competitor F) |
| family dentist | 0% | 45% | 70% (Competitor G) |
| Average | 4% | 13% | 59% (mixed) |
An HVAC location: its main competitor leads on all nine keywords.
The HVAC location across nine keywords: from an 80% map share for “air conditioning repair” down to 14% for “heating repair”.
| Keyword | This business | Main competitor | Highest map share (anyone) |
|---|---|---|---|
| air conditioning repair | 80% | 86% | 86% (main competitor) |
| hvac contractor | 75% | 87% | 87% (main competitor) |
| heat pump repair | 75% | 98% | 98% (main competitor) |
| ac installation | 70% | 96% | 96% (main competitor) |
| air conditioning contractor | 67% | 95% | 95% (main competitor) |
| furnace repair | 67% | 89% | 89% (main competitor) |
| hvac repair | 53% | 92% | 92% (main competitor) |
| ac repair | 44% | 88% | 88% (main competitor) |
| heating repair | 14% | 91% | 91% (main competitor) |
| Average | 61% | 91% | 91% (mixed) |
3. Multiple locations, multiple keywords (chains, franchises, private equity)
A dental group: one brand, eight offices, eight different pictures.
Eight of the group’s offices, each measured on its own map for “dentist” and “dental implants”. Average map share ranges from 1% (Office C) to 11% (Office B). At every office, the main competitor holds more of the map than the office does. Seven different businesses are the main competitor across the eight offices.
How we track it: one number per location, the average map share across its keywords. We can always go back to each keyword’s map share, or its full map, from that scan.
| Location | This business | Main competitor | Highest map share (mixed) |
|---|---|---|---|
| Office A (most reviewed) | 4% | 41% | 52% |
| Office B | 11% | 46% | 71% |
| Office C | 1% | 45% | 57% |
| Office D | 9% | 50% | 75% |
| Office E | 4% | 36% | 55% |
| Office F | 10% | 41% | 59% |
| Office G | 4% | 47% | 73% |
| Office H | 4% | 48% | 59% |
An HVAC company: same company, very different reach.
The company’s five locations, each measured on its own map for “ac repair”, “hvac contractor” and “ac installation”. Average map share ranges from 0% (Location 5) to 63% (Location 1). At every location, the main competitor holds more of the map than the location does. Each location faces a different main competitor: five locations, five different rivals.
| Location | This business | Main competitor | Highest map share (mixed) |
|---|---|---|---|
| Location 1 (most reviewed) | 63% | 90% | 90% |
| Location 2 | 13% | 78% | 79% |
| Location 3 | 30% | 46% | 71% |
| Location 4 | 16% | 42% | 45% |
| Location 5 | 0% | 90% | 91% |
Direction, not a score
Map share isn’t a score to chase. It shows direction: whether the local SEO work is having a positive impact. What matters in the end, and what we monitor, is the change in total leads.
Map share is one of the measures behind Market Visibility, the first pillar of the MOSAIC Six, a framework I developed for connected growth in local businesses.
Method notes
- Scanned Monday, October 5, 2026, during business hours. Each grid is 13 by 13 points, half a mile apart, centered on the location: mobile results, the top 20 recorded at every point, ads not counted.
- The dental office in sections 1 and 2 is Office A in section 3, and the HVAC location is Location 1.
- Three more keywords were scanned and left out of the analysis: “dentures”, “duct cleaning” and “emergency dentist”.
- One search never returned (Office A, “dental clinic”). It is left out of that keyword’s count rather than treated as a miss.
- Shares are counted from the points and rounded once, for display.
- Map data © OpenStreetMap contributors, available under the Open Database License.