How to Track Google Maps Rankings for Many Keywords and Locations
The written version, with the maps and tables: Three ways we measure a local business’s map share.
Transcript
0:00 Tracking Google Maps rankings: easy for one search term, messy for many
Tracking your Google Maps rankings is easy when it’s one search term for one location, but it gets messy fast when you track many search terms or many locations. I’ll show you a simple way to keep track of it all, month to month.
0:13 Who I am, and where map rankings sit in local SEO
I’m Ala Al-Shaibani. I run Mazaya Digital, and this is how we track rankings for the businesses we work with. You can use it for your own business or to check your agency’s reports. Google Maps rankings are part of local SEO. In the MOSAIC Six, my framework for growing local businesses, it sits under Market Visibility. In a previous video, I covered why map rankings matter and how to rank higher. The link is in the description. In this video, we’ll go through three scenarios, one location and one search term, one location and many search terms, and many locations.
0:47 What map share means
One number that will come up often is map share. We search from spots all across a business’s area and map share is the share of those spots where the business shows up in Google’s top three.
0:57 Scenario 1: one location, one search term
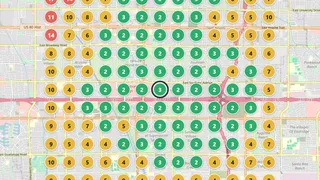
So let’s start with the first scenario. One location and one search term. This is the easy one. When you track one search term for one location, one map is easy to follow. Each dot is a search from that spot. Green means you’re in the top three. And your map share is the percentage of green spots. So you can see at a glance where you’re strong and where you’re missing. For this video, I’m using real scans for a dental office and an HVAC company. The two businesses aren’t my clients. They’re just good examples.
1:25 A dental office: #1 at its own door, top three on 7% of its map
So let’s take this dental office in Phoenix. And the search term is dentist. It’s number one at its own front door, but its map share is 7%. Across most of the map, it isn’t even in the top 20.
1:38 13,000 Google reviews, and #1 nowhere
On the other hand, this HVAC business shows up for “ac repair” almost everywhere on its map. And it’s in the top three on almost half of it, but it’s number one nowhere. This business has more than 13,000 Google reviews, and a competitor with a fraction of those reviews is number one on most of the map. Just another example proving that review count alone doesn’t buy the top spot. So with one term, tracking one map month-to-month is simple. Run the same map again and put the two side-by-side. Did the green spread or shrink? That shows how your visibility is changing. But what happens when you track more than one search term?
2:13 Scenario 2: one location, many search terms
This takes us to scenario two. One location, many search terms. Most businesses don’t sell just one thing. A dental office does cleanings, implants, whitening, root canals, and people search for each of those in different words. Each search term gets its own map. Here’s the same dental office with a map for each of the eight search terms. Each map shows where it ranks. Now try comparing eight maps this month with eight maps last month. Tracking what changed gets hard fast. And if you can’t see what moved, it’s hard to tell how your visibility is changing.
2:45 Turn eight maps into one table
So we turn the maps into a table. One row per search term. First is the share of the map where the office is in the top three. Then is its main competitor’s map share. And last, the highest map share anyone holds on that term, whichever business it is. Now you can read it at a glance. This office does best on root canal. For cosmetic dentist, teeth whitening, dental implants and family dentist, its map share is zero. It isn’t in the top three anywhere. And on average, its main competitor holds about three times as much of the map. The HVAC location tells a different story. It’s strong in the top three on most of its map for air conditioning repair, and much weaker for heating repair. But one competitor leads on every single search term. So every month, you run the same scans and compare the table row by row. When a row moves, you can go back to that search term’s map to see where.
3:39 Scenario 3: many locations
Now, what if you have more than one location? This is scenario three, multiple locations. For a chain, franchise, or group, every location has its own maps and its own table. Now try comparing eight tables with last month’s eight. It gets hard to follow. So each location becomes one row: its map share averaged across the search terms you track, next to its own main competitor’s. The last column is a benchmark, the best share on each search term averaged, whoever holds it.
4:08 A dental group: eight offices, almost every one with a different main rival
Here’s the group that dental office belongs to, eight of its offices on dentist and dental implants. At every office, the main competitor holds more of the map than the office does. And almost every office faces a different main competitor. That’s hard to see from the maps alone.
4:24 An HVAC company: five locations, five different rivals
And here are the HVAC company’s five locations on three search terms. One averages well over half of its map. Another isn’t in the top three anywhere. And every location has a different main rival. This one table shows you which locations need a closer look. Then you open that location’s table and its maps to see where it’s falling behind. Whichever way you track, keep it the same every month. The same search spots and the same search terms. Change the area you search and your map share changes with it.
4:54 Three things to take away
So three things to take away. If you have one location and one search term, track the map and compare it month to month. If you have many search terms, turn the maps into one table and watch the rows that matter most to your business. If you have many locations, one row per location, each against its own local competitors, then take a closer look at the ones that need it. Do that, and once a month, one table tells you what moved and where to look. And remember, map share isn’t a score to chase. It shows direction, whether your visibility is moving the right way. What really counts is your leads.
5:27 Request a free map check
If you run a local business and want to see where you rank on Google Maps, request a free map check through the link in the description. I’ll check one main service in one location and email you a map of your local rankings with a short explanation. Now, what happens when your customers ask ChatGPT or other AI agents who to choose? That’s the next video. Subscribe and you won’t miss it.
Sources
- The maps and tables: measured by Mazaya Digital in Phoenix. 13 by 13 search spots half a mile apart, on mobile, ads not counted.
- The month-to-month comparisons, and the “last month” column on the HVAC table, are illustrations, not scans.
- Map data © OpenStreetMap contributors, available under the Open Database License.